TSM Deep Analysis: Weekly Market Assessment
⚠️ DISCLAIMER: This analysis is for informational and educational purposes only. It does not constitute investment advice, a recommendation, or a solicitation to buy or sell any security. All data is derived from public filings, market data, and algorithmic assessment. Past performance is not indicative of future results. Consult a qualified financial advisor before making investment decisions.
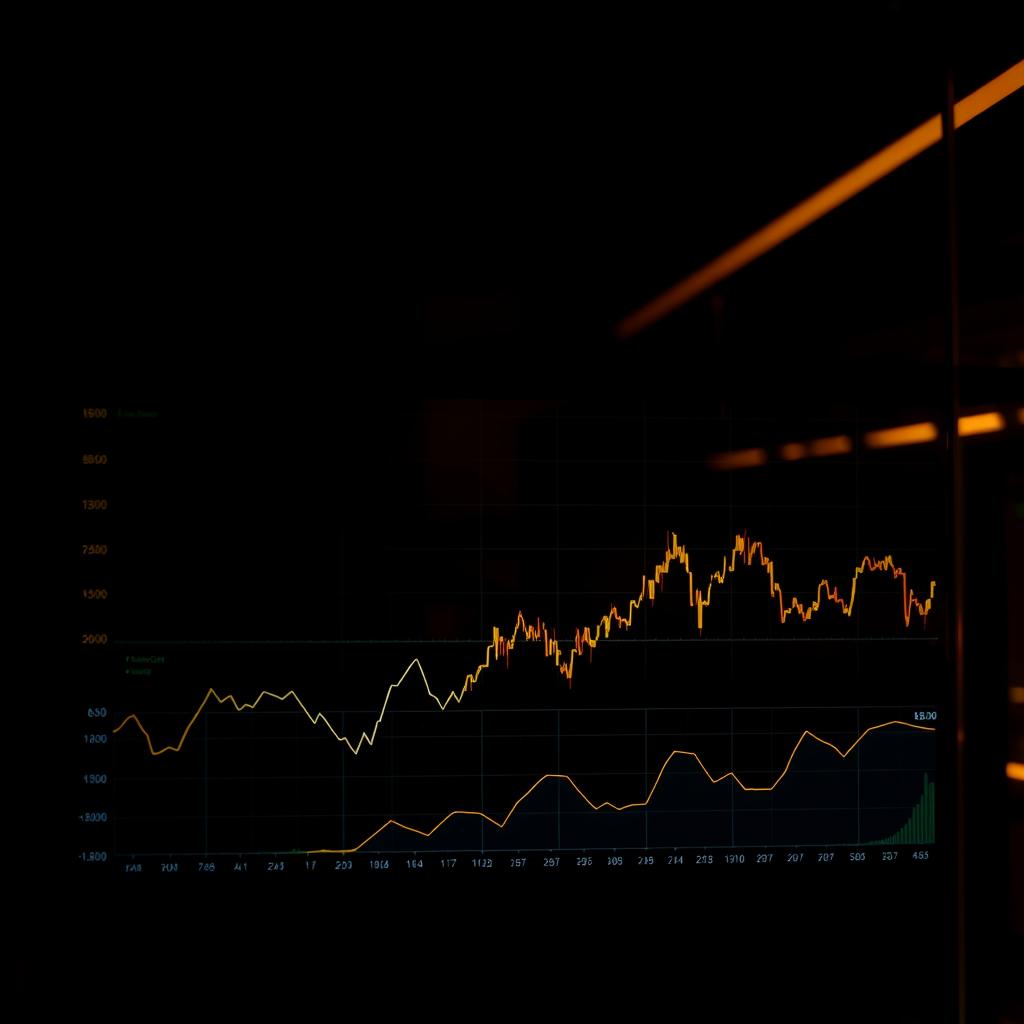
Taiwan Semiconductor Manufacturing (TSM) has established itself as a key player in the foundry sector. With a market cap of ~$2.2T and net cash of N/A, the company sits at a critical juncture — QuantBrainAI’s multi-agent system assigns a Hold rating (score: 61/100) based on analysis across 15 strategy frameworks. This report breaks down the technical signals, market context, game theory equilibrium, and smart money sentiment informing that decision.
📊 Technical Snapshot
| Indicator | Signal | Value |
|---|---|---|
| RSI (14) | 🟡 Neutral | 54.1 |
| MACD | 🟢 Bullish | +0.51 |
| Bollinger Bands | 🟡 Neutral | Upper $447.08, Mid $414.73, Lower $382.38 |
| SMA (50) | 🟢 Above | $389.03 |
| SMA (200) | 🟢 Above | $325.32 |
| OBV | 🟢 Bullish | 🟢 Uptrend |
| ATR (14) | 🟡 Moderate | 3.9% |
| Volume | 🟡 Neutral | Normal |
📈 Multi-Agent Strategy Signals
QuantBrainAI runs 15 concurrent analytical strategies on every ticker. Here’s the full signal map for TSM:
| Strategy Signal | Signal | Detail |
|---|---|---|
| 📈 Trend & Momentum | ||
| MA Crossover | 🟡 Neutral | Price vs SMA crossovers — no clear signal. |
| Trend Following | 🟡 Neutral | Consolidation on weekly. |
| Momentum | 🟡 Neutral | RSI, MACD readings — RSI at 54.1. |
| 📊 Valuation & Growth Quality | ||
| Growth Quality | 🟢 Buy | Revenue growth, FCF, PEG ratio — forward PE (21.3×) attractive vs trailing (35.6×). |
| Valuation Re-rate | 🟢 Bullish | Forward P/E vs growth rate — multiple compression, re-rate potential. |
| 📊 Volume & Flow | ||
| Volume Breakout | 🟡 Neutral | Volume analysis — normal levels (1.0x avg). |
| Capital Flow | 🟢 Inflow | MFI, money flow indicators — OBV trending higher, accumulation. |
| 📊 Market Dynamics | ||
| Event-Driven | 🔴 Sell | Post-earnings/post-event price change of -6.7% — negative momentum. |
| Sector Rotation | 🟡 Neutral | Sector vs market performance — data unavailable. |
| Sentiment | 🟡 Mixed | Analyst ratings, short interest — data unavailable. |
| 📊 Technical Patterns | ||
| Channel Breakout | 🟡 Neutral | Bollinger bands, consolidation patterns — within normal range. |
| Elliot Wave | 🟡 Neutral | Impulse/corrective wave structure — data unavailable. |
| Oversold Reversal | 🟡 Neutral | Distance from moving averages — RSI at 54.1, neutral zone. |
| Mean Reversion | 🟡 Neutral | Distance from long-term mean — within normal range. |
| Resistance Break | 🟡 Watch | Key resistance levels, ATH proximity — 7.8% from ATH. |
Decision Summary
QuantBrainAI’s multi-agent analysis of TSM:
Signal: 🟡 Neutral | Score: 61.15332513854166
Key Levels:
- Support: $385.06
- Resistance: $450.16
🎲 Game Theory Equilibrium
The multi-agent game model positions TSM within the foundry sector. The equilibrium score reflects network effects from interconnected ecosystem participants.
| Metric | Solo Score | Equilibrium Score | Divergence |
|---|---|---|---|
| TSM | 0.758 | 0.915 | +0.157 |
Ecosystem force: 52.2% | Signal: bullish | Confidence: medium
Top Influencers:
| Player | Power | Weight | Contribution | Group |
|---|---|---|---|---|
| NVDA | 0.872 | +0.6 | +0.5232 | us-compute |
| ASML | 0.672 | +0.6 | +0.4032 | fab-tools |
| AVGO | 0.784 | +0.5 | +0.3920 | us-compute |
| AMD | 0.702 | +0.5 | +0.3510 | us-compute |
| GOOG | 0.756 | +0.4 | +0.3024 | us-ai-lab |
Scenario Probabilities
| Scenario | Probability | Trigger |
|---|---|---|
| 🟢 Best Case | 24% | Ecosystem tailwinds accelerate (NVDA scaling, cloud capex surge) — but competitors likely saw it first |
| 🟡 Base Case | 47% | Current equilibrium holds — though our data lags competitors’ |
| 🔴 Worst Case | 29% | Export controls widen or competitor disruption — risk likely understated by public data |
🐋 Smart Money Sentiment / Market Flow
Data source: Hyperdash cohorts — real-time on-chain wallet cohort analysis from Hyperliquid equity perps trading activity.
Extremely Profitable Cohort ($1M+ realized PNL):
- Bias: Short
- Net Position: $536,130,000 short
Apex Cohort ($5M+ equity):
- Bias: Neutral
- Net Position: Data pending
Verdict: Smart money positioning reflects macro caution across equities via perps. The net short bias from high-performance cohorts signals informed capital hedging against near-term downside.
Data source: Qwantify — Hyperliquid on-chain order flow.
Order flow data being collected for next refresh cycle.
About Taiwan Semiconductor Manufacturing
Taiwan Semiconductor Manufacturing Company Limited, together with its subsidiaries, manufactures, packages, tests, and sells integrated circuits and other semiconductor devices in Taiwan, China, Europe, the Middle East, Africa, Japan, the United States, and internationally. It provides various wafer fabrication processes, such as processes to manufacture complementary metal- oxide-semiconductor (CMOS) logic, mixed-signal, radio frequency, embedded memory, bipolar CMOS mixed-signal, and others. The company also involved in providing customer and engineering support services; manufacturing of masks; investment in technology start-up companies; research, designing, developing, manufacturing, packaging, testing, and sale of color filters; and investment activities. Its products are used in high performance computing, smartphones, Internet of things, automotive, and digital consumer electronics. Taiwan Semiconductor Manufacturing Company Limited was incorporated in 1987 and is headquartered in Hsinchu City, Taiwan.
Products & Services
- Data center and AI accelerator solutions
- Networking and connectivity platforms
- Custom silicon and ASIC design services
- Infrastructure software and optimization tools
Highlights
- Strategic positioning within the foundry ecosystem
- Strong customer relationships with hyperscale cloud providers
- Diversified product portfolio spanning hardware and software
Future Growth
- AI infrastructure demand driving compute and networking upgrades
- Expanding total addressable market through ecosystem partnerships
- Ongoing innovation in process technology and chip architecture
📊 Market Context
| Market Context | 1W | 1M | 3M | YTD | 1Y |
|---|---|---|---|---|---|
| ── TSM Performance ── | |||||
| TSM | -0.8% | +5.3% | +17.9% | +30.3% | +104.9% |
| SOX | -4.7% | +11.3% | +57.4% | +65.9% | +142.6% |
| ── US Indices ── | |||||
| S&P 500 | -2.6% | +1.7% | +8.3% | +7.7% | +23.1% |
| NASDAQ | -4.7% | +1.5% | +14.2% | +10.6% | +31.6% |
| Dow Jones | -0.3% | +3.2% | +4.9% | +5.1% | +19.0% |
| ── International Semis Markets ── | |||||
| KOSPI (Korea) | -0.3% | +23.7% | +29.4% | +89.4% | +190.2% |
| TAIEX (Taiwan) | +0.8% | +9.6% | +28.4% | +53.6% | +107.9% |
| ── Crypto & Commodities ── | |||||
| Bitcoin | -14.0% | -22.4% | -9.9% | -31.8% | -45.3% |
| Gold | -4.9% | -4.8% | -15.1% | +0.5% | +30.5% |
| WTI Crude | +3.6% | -11.5% | +21.4% | +58.0% | +40.2% |
📰 News Summary
1. Is Taiwan Semiconductor Stock a Buy Before July? — Jun 06, 2026
The stock is near its 52-week high as AI chip demand continues to outpace supply. Source: Motley Fool Read more
2. TSMC CEO sends blunt message to memory chip rivals — Jun 05, 2026
One of the most important chipmakers on the planet could be squeezing its customers right now, as the AI shortage gives it every excuse. But its CEO said he won’t. Taiwan Semiconductor Manufacturing ( Source: TheStreet Read more
3. Why TSMC Is a Better AI Stock to Hold Right Now Than Broadcom — Jun 05, 2026
TSM is outperforming peers as rising AI demand, a higher 2026 outlook and capacity expansion support growth despite a broader chip-sector pullback. Source: Zacks Read more
4. TSMC CEO Issues Stark AI Supply Warning — Wedbush Sees Big Opportunity — Jun 05, 2026
TSMC’s AI Demand Forecast Sparks Bullish Call From Top Wall Street Firm Source: GuruFocus.com Read more
5. Taiwan Semiconductor CEO Says Rivals Have Years To Catch Up — Jun 05, 2026
Taiwan Semiconductor Manufacturing Co. Ltd. stock fell about 2% in premarket trading Thursday as investors pulled back from technology stocks and locked in gains after the stock’s strong rally over th Source: Benzinga Read more
Sources
Data sourced from public markets via yfinance and QuantBrainAI data pipeline APIs. Individual citations noted inline with [N] markers where applicable.
⚠️ Disclaimer: This is not financial advice. All data sourced from public markets. Always do your own research before making investment decisions.
Changelog
- 2026-06-06: Automated quant refresh — multi-agent strategy assessment, game theory equilibrium, and smart money sentiment.