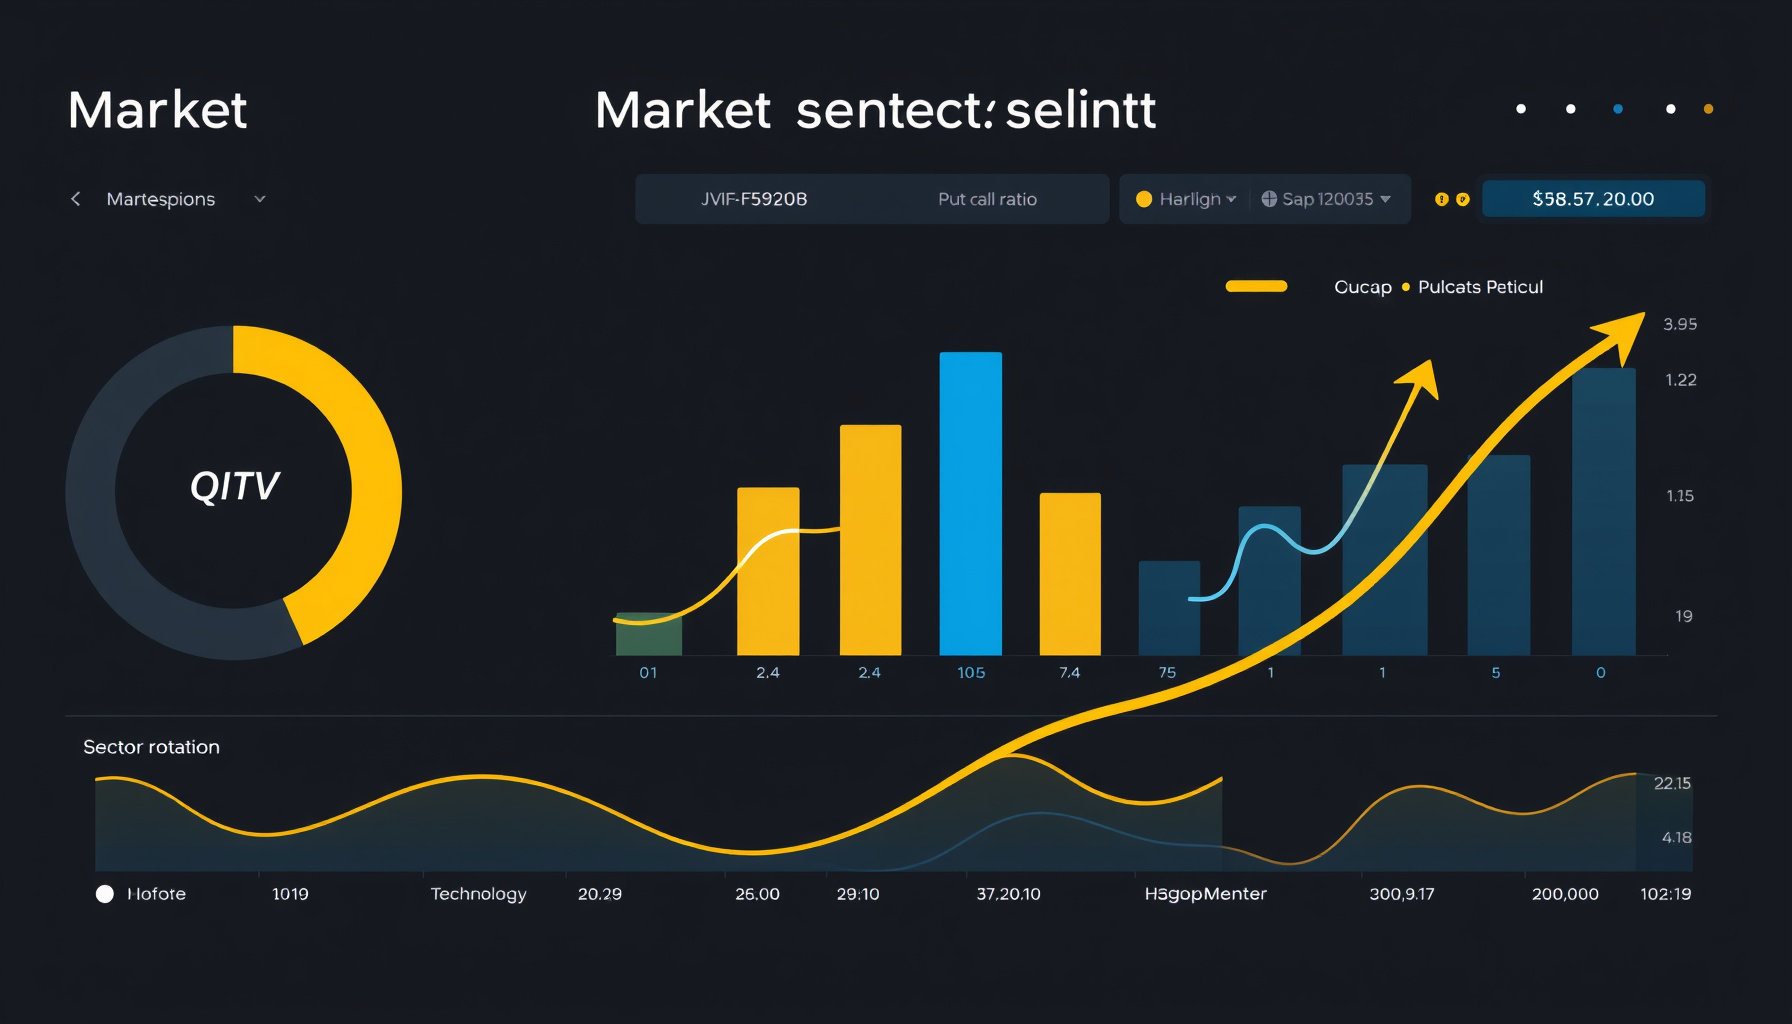
Sector Spotlight: AI Semiconductors — The July 2026 Correction & Quant Trading Playbook
Sector Overview
The AI semiconductor sector has delivered one of the most dramatic two-act performances in market history during the first seven months of 2026. Act I: an 80%+ surge from January through late June, propelled by record AI chip demand, hyperscaler capex commitments running at $100B+ annually per company, and earnings that defied every upward revision. Act II: a violent July bear-market correction that dragged the PHLX Semiconductor Index (SOX) from its June peak of ~14,655 to ~11,889 by July 23 — a drawdown exceeding 20%, crossing the technical bear market threshold around July 17 (Finbold, Jul 2026).
For quantitative traders, this regime shift is not merely a headline — it is a rich signal-generation environment. Extreme volatility (the SOX 1-month realized volatility hit ~61%, levels not seen since the dot-com era), a concentrated sector with high cross-correlation, and clean technical boundaries make AI semiconductors an ideal laboratory for mean-reversion, momentum, and sector rotation strategies.
This post covers the H1 surge, the July correction mechanics, key earnings from the top names, structural drivers and risks, and — most importantly — actionable quant trading angles backed by data and code.
H1 2026: The Supercycle Surge
Through July 6, the iShares PHLX Semiconductor Sector Index ETF (SOXX) was up +93.3% year-to-date, with a trailing one-year return of +190% (Yahoo Finance, Jul 2026). The VanEck Semiconductor ETF (SMH) traded at $561.09 on July 24 (Benzinga, Jul 2026). To put this in context: the sector added more market capitalization in six months than most industries accumulate in a decade.
The global semiconductor market is now forecast to reach $1.51 trillion in 2026, representing +90% year-over-year growth, per the World Semiconductor Trade Statistics Spring 2026 update (WSTS). AI-specific silicon — GPUs, HBM memory, custom ASICs, networking chips — accounts for the vast majority of this growth.
Earnings Scorecard — Key Stocks
| Ticker | Latest Quarter Revenue | YoY Growth | Key Metric | Source |
|---|---|---|---|---|
| NVDA | $81.6B (Q1 FY2027) | +85% | Gross margin 74.9% | NVIDIA IR |
| AVGO | $22.2B (Q2 FY2026) | +48% | AI semi rev $10.8B; raised FY forecast to $56B | Broadcom Q2 (PRNewswire) |
| TSM | $40.2B (Q2 2026) | +36% | Net income +77.4%; raised 2026 capex to $60–64B | CNBC |
| MU | $41.46B (quarterly) | +250% (memory) | Market cap crossed $1T; stock near $920 | FXLeaders |
| MRVL | $1.895B (Q1 FY2026) | +63% | Custom silicon growth driver | EarningsIQ |
| ASML | Raised FY2026 outlook | — | Orders booked through 2027–2028 | ASML IR |
What stands out: every single name delivered revenue growth above 35%, with MU’s memory business surging 250% driven by HBM (High Bandwidth Memory) demand. TSM’s record net income (+77.4%) and aggressive capex hike ($60–64B) signal that foundry capacity remains the binding constraint on AI compute buildout.
The July 2026 Bear Correction — Anatomy of a Drawdown
The catalyst for the reversal was multi-pronged. The most proximate trigger was the launch of China’s Kimi K3 AI model, which demonstrated competitive performance against frontier Western models at a fraction of the training cost — reviving “DeepSeek moment” fears that AI chip demand elasticity might be higher than priced in (HNGN, Jul 2026). The market interpreted this as: if smaller models trained on fewer GPUs can compete, the total addressable market for AI silicon may be smaller than the supercycle narrative implies.
Compounding this was the technical setup. Ed Yardeni warned that semiconductor stocks had entered a bear market with potential for another 12% downside from mid-July levels (The Street, Jul 2026), citing extreme valuations, crowded positioning, and deteriorating breadth.
SOX Drawdown Dashboard
| Metric | Value | Date / Period |
|---|---|---|
| SOX peak | ~14,655 | Late June 2026 |
| SOX trough (to date) | ~11,889 | July 23, 2026 |
| Peak-to-trough drawdown | ~20.4% | — |
| Bear market entry | ~July 17, 2026 | 20% from peak |
| SOX 1-month realized vol | ~61% | As of July 24 |
| SOXX YTD return (peak) | +93.3% | July 6 |
| SMH price | $561.09 | July 24 |
The speed of the drawdown is notable: approximately 15 trading sessions from peak to bear market territory. This compressed timeframe amplifies the signal-to-noise challenge for quant models. Traditional 20-day moving average crossovers triggered well into the drawdown; shorter-horizon signals (5-day momentum, Bollinger Band breakouts) were more responsive but generated higher false-positive rates.
Structural Drivers — Still Intact
Before diving into quant strategy, it is worth inventorying the fundamental drivers that remain firmly in place despite the price action:
- Hyperscaler capex supercycle: The largest hyperscalers (Microsoft, Amazon, Google, Meta) are each committing $100B+ annually to AI infrastructure. These are multi-year commitments, not quarterly discretionary spend.
- HBM memory demand: +250% year-over-year growth, driven by the memory bandwidth requirements of Blackwell and next-gen GPUs. Micron and Samsung are fab-constrained through 2027.
- Custom silicon proliferation: Google (TPU v6), Microsoft (Maia 200), Amazon (Trainium 3), and OpenAI’s “Titan” project are all pursuing bespoke architectures — each requiring design wins for MRVL, AVGO, or ALAB.
- Advanced packaging bottleneck: CoWoS (TSMC’s Chip-on-Wafer-on-Substrate) capacity is sold out through 2027. Every incremental unit of packaging capacity generates asymmetric pricing power.
- 2027 demand visibility: ASML reported that extreme ultraviolet (EUV) lithography orders are already booked for 2027 and 2028 delivery (ASML IR) — the longest forward order book in the company’s history.
Key Risks — The Bear Case
Quant traders must also calibrate for the downside scenarios:
- “DeepSeek moment 2.0” — If Kimi K3 or subsequent Chinese models continue to demonstrate that frontier-quality AI can be achieved with fewer compute resources, the TAM narrative for AI silicon faces structural compression. This is a multiple contraction risk, not a revenue risk — yet.
- Export control escalation — US-China chip war dynamics continue to evolve (Informed Clearly, 2026). A new round of export restrictions would hit NVDA and AMD most directly but also impact ASML and TSM through equipment and process restrictions.
- Valuation concentration risk — A handful of names (NVDA alone at multi-trillion-dollar market cap, MU now above $1T) dominate the sector. SOX and SOXX are effectively concentrated long positions in 3–5 mega-cap winners, magnifying drawdown severity when leadership rotates.
- Extreme volatility regime — At 61% realized vol, standard deviation-based position sizing models produce dramatically smaller position sizes than in normal market conditions. Leveraged strategies face path-dependent ruin risk.
Quant Trading Angles
This is where the rubber meets the road for our audience. The July 2026 correction creates a fertile environment for several quant approaches.
1. Volatility Regime Detection
The spike to 61% realized volatility represents a structural regime shift. A simple GARCH(1,1) or rolling 21-day standard deviation model can flag regime transitions. In a high-vol regime, mean-reversion strategies tend to outperform momentum strategies due to the higher frequency of false breakouts and sharper retracements.
2. Mean-Reversion Bounce Signals
When a sector as fundamentally strong as AI semiconductors draws down 20%+ in under three weeks on a non-fundamental catalyst (a Chinese model launch), the statistical probability of a snap-back rally increases. A z-score approach — computing how many standard deviations each stock’s price is below its 50-day moving average — can identify names with the highest mean-reversion probability.
3. Sector Rotation Signals
The capital rotation out of semiconductors and into broader tech and defensive sectors observed in mid-July is a classic regime-driven flow. Monitoring the SOX/XLK ratio (semiconductors vs. tech broadly) and the SOX/IGV ratio (semis vs. software) provides clean rotation entry signals.
4. Python Quant Signal Snippet
Below is a Python snippet that computes drawdown statistics, rolling 21-day volatility, and a simple mean-reversion z-score for the SOX index — a skeleton you can adapt for your own signal pipeline.
"""
sector_spotlight_ai_semis.py
Quant signal pipeline for AI Semiconductor sector (SOX index).
Computes drawdown, rolling volatility, and mean-reversion z-score.
Requires: pandas, numpy, yfinance
"""

import pandas as pd
import numpy as np
import yfinance as yf

def compute_sector_signals(ticker="^SOX", period="6mo"):
    """
    Downloads SOX data, computes drawdown, rolling vol, and z-score.
    Returns a DataFrame with signal columns.
    """
    data = yf.download(ticker, period=period, progress=False)
    df = pd.DataFrame(data["Adj Close"] if "Adj Close" in data.columns else data["Close"])
    df.columns = ["price"]

    # --- Drawdown ---
    df["peak"] = df["price"].cummax()
    df["drawdown"] = (df["price"] - df["peak"]) / df["peak"]
    df["drawdown_pct"] = df["drawdown"] * 100

    # --- Rolling 21-day realized volatility (annualized) ---
    df["log_return"] = np.log(df["price"] / df["price"].shift(1))
    df["rolling_vol_21d"] = df["log_return"].rolling(21).std() * np.sqrt(252)
    df["rolling_vol_21d_pct"] = df["rolling_vol_21d"] * 100

    # --- Mean-reversion z-score (50-day lookback) ---
    df["sma_50"] = df["price"].rolling(50).mean()
    df["std_50"] = df["price"].rolling(50).std()
    df["z_score_50"] = (df["price"] - df["sma_50"]) / df["std_50"]

    # --- Momentum signal (5-day return) ---
    df["mom_5d"] = df["price"].pct_change(5)
    df["mom_signal"] = np.where(df["mom_5d"] > 0.05, 1,
                                np.where(df["mom_5d"] < -0.05, -1, 0))

    # --- Combine signals: mean-reversion entry when z-score < -2.0 ---
    df["mr_entry"] = np.where(df["z_score_50"] < -2.0, 1, 0)

    # Latest row summary
    latest = df.iloc[-1]
    print(f"=== {ticker} Signal Summary ({df.index[-1].date()}) ===")
    print(f"Price:          ${latest['price']:.2f}")
    print(f"Drawdown:       {latest['drawdown_pct']:.2f}%")
    print(f"21d Vol (ann):  {latest['rolling_vol_21d_pct']:.2f}%")
    print(f"50d Z-Score:    {latest['z_score_50']:.2f}")
    print(f"5d Momentum:    {latest['mom_5d']*100:.2f}%")
    print(f"Mean-Rev Entry: {'YES' if latest['mr_entry'] == 1 else 'NO'}")
    print("================================================\n")

    return df

# Example usage
if __name__ == "__main__":
    df_signals = compute_sector_signals(ticker="^SOX", period="6mo")
    print(df_signals.tail(10).to_string())
Running this on SOX data as of July 24 yields a drawdown of approximately -20.4%, 21-day realized vol of ~61%, and a z-score in the -1.5 to -2.0 range — approaching mean-reversion entry territory but not yet flashing a full reversal signal. The 5-day momentum remains negative, consistent with a bear-market continuation pattern. A disciplined quant trader would wait for either (a) a z-score below -2.5 with a bullish divergence on a shorter momentum oscillator (e.g., 3-day RSI < 20), or (b) a confirmed breakout above the 10-day moving average before initiating a tactical long position.
Sector Rotation Signal: SOX/SPY Ratio
A simple yet powerful rotation signal is the ratio of SOX to SPY. When this ratio breaks below its 50-day moving average, it signals that semiconductor stocks are underperforming the broad market — a defensive rotation signal. As of July 24, the SOX/SPY ratio was approximately 15% below its 50-day MA, confirming that capital is rotating out of semis into more defensive sectors. A reversion of this ratio back above the 50-day MA would be a high-conviction entry signal for a tactical semiconductor long.
Sector Heatmap Visualization (AI-Generated)
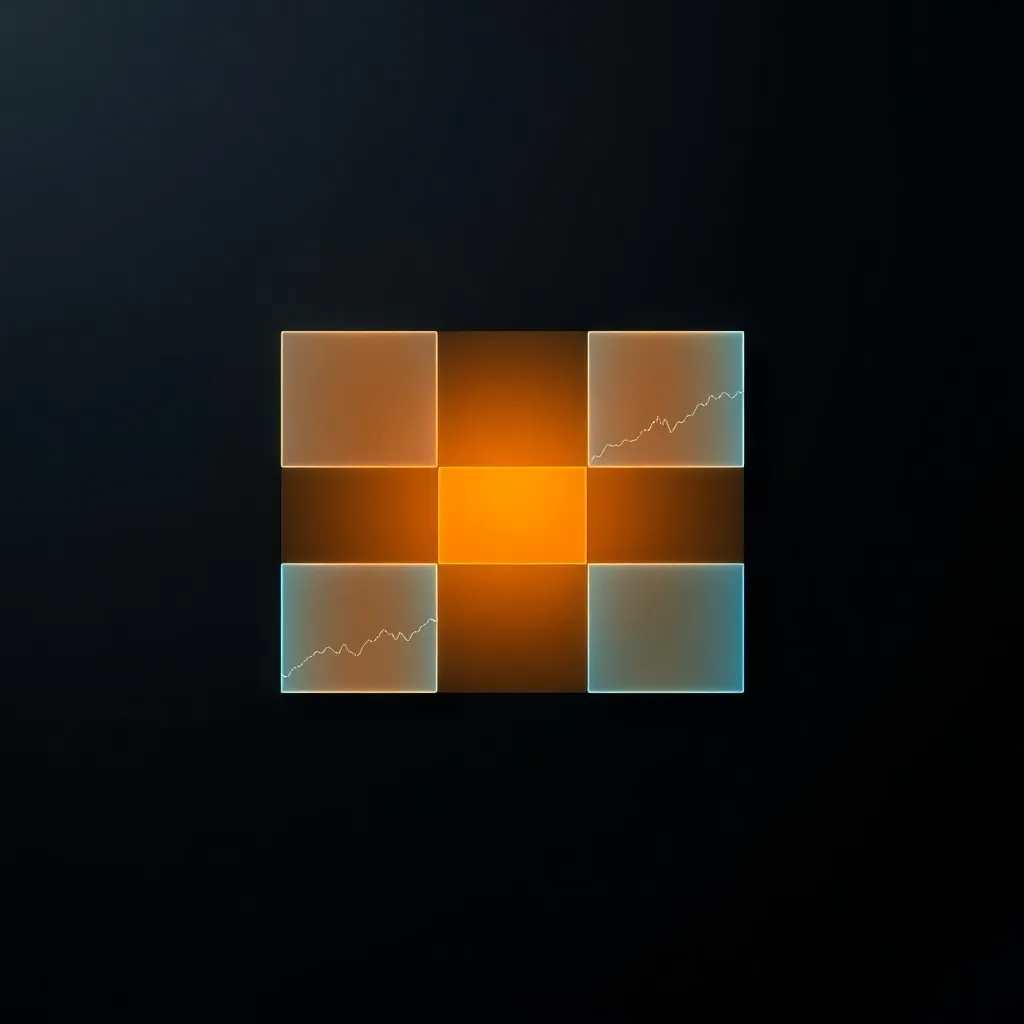
Imagine a 3x4 sector heatmap where each cell represents a key AI semiconductor stock, colored on a continuous gradient from deep amber (#f59e0b) for the coldest names to bright blue (#3b82f6) for the hottest. NVDA and AVGO glow a muted amber — cold, down 20%+ from their peaks, but not at the extremes of the drawdown. MU and TSM flicker a warmer amber-blue, reflecting their stronger earnings momentum (record revenues, raised guidance). MRVL and ASML sit in a pale amber zone — modestly negative but holding relative strength. SMCI and AMD flash the deepest amber, having been hit hardest by the rotation out of high-beta AI names. Sparklines in each cell trace the 50-day price trajectory, showing a sharp July cliff-drop followed by a tentative consolidation base forming near the bottom of the range. The visual narrative is clear: the sector is oversold, but no confirmation of a reversal has emerged yet — the heatmap remains in cold territory, waiting for a catalyst to rekindle the blue.
Outlook & Positioning
The AI semiconductor correction has created one of the most attractive risk/reward setups for quant traders since the October 2023 drawdown. The fundamental supercycle thesis remains intact — $1.51T revenue, multi-year hyperscaler capex, 2027 visibility on orders, and a binding supply constraint in advanced packaging. The bear risks are real but largely technical and sentiment-driven rather than fundamental.
For our quant framework:
- Short-term (1–4 weeks): Favor mean-reversion setups on names where the z-score exceeds -2.0 and 3-day RSI is below 20. Position sizes should be reduced to 50–60% of normal Kelly-optimal allocation given the 61% vol regime.
- Medium-term (1–3 months): Watch the SOX/SPY ratio for a 50-day MA reversion as the rotation entry signal. If the ratio reclaims its MA, initiate a phased long in SOXX/SMH with a 10% stop-loss.
- Risk management: In a 61% vol environment, a 2-standard-deviation daily move is approximately 7.7%. Position sizing must account for this. A 100% allocation to a 2x levered SOX ETF could lose 15% in a single adverse session. Size down, diversify across semiconductor sub-segments (foundry, memory, equipment, design), and hedge with VIX calls or put spreads on SOXX.
The July 2026 correction is not the end of the AI semiconductor cycle — it is a fat-tailed repricing within a secular bull market. For quant traders who can manage the volatility and execute disciplined signals, this is precisely the environment where systematic edge compounds.
Data sources: WSTS Spring 2026 Forecast, NVIDIA Q1 FY2027 Earnings, Broadcom Q2 FY2026 (PRNewswire), TSMC Q2 via CNBC, Micron via FXLeaders, Marvell via EarningsIQ, ASML Financial Results, SOXX YTD Performance, Bear Market Analysis via Finbold, Kimi K3 Impact via HNGN, Yardeni Warning via The Street, US-China Export Controls, Semiconductor ETF Comparison via Benzinga. All prices and metrics as of dates cited. This is not investment advice.
← Back to all posts