TrendSpider Review 2026: AI Charting, Strategy Lab, and Automated Backtesting for Quants
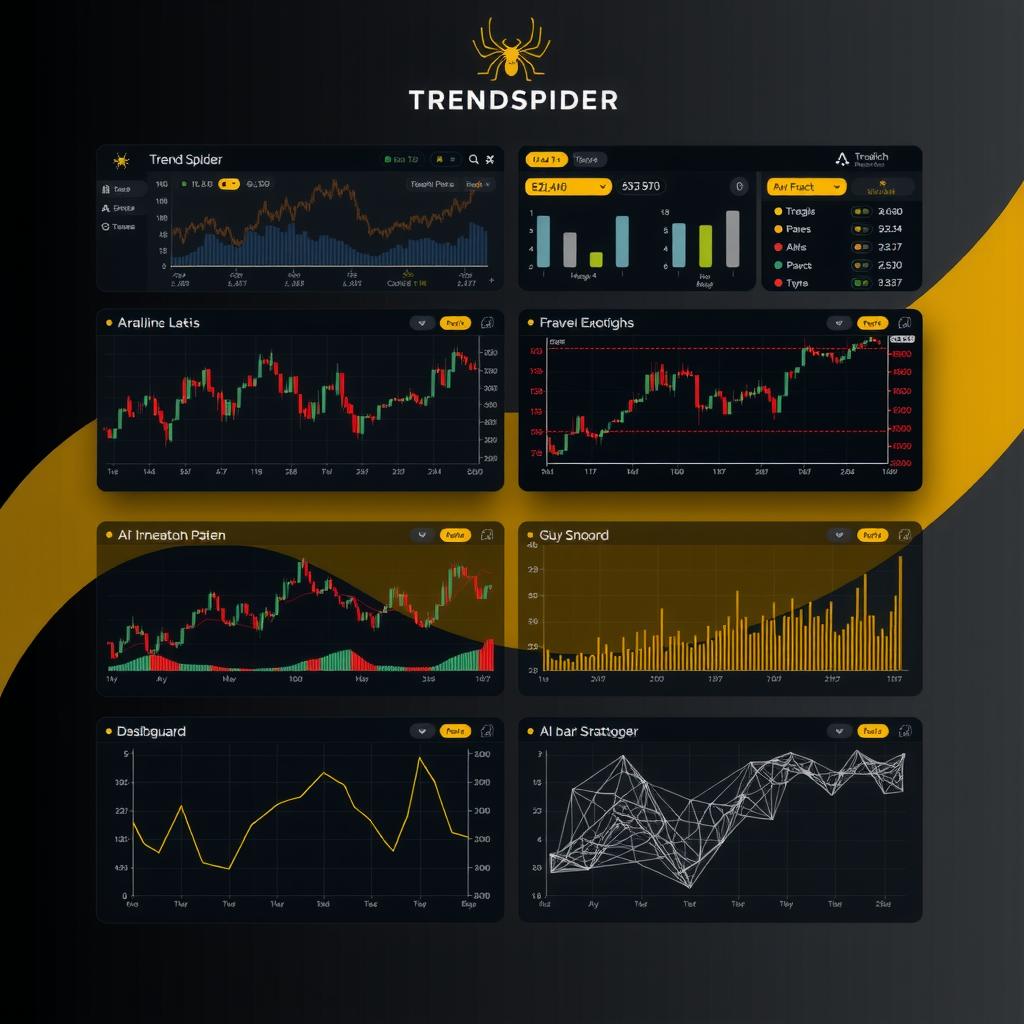
TrendSpider has evolved from a charting tool with automated trendlines into a full-stack trading platform: charting, scanning, backtesting, ML model training, AI chat assistant, and automated bot execution all in one system.
For quants, the question is whether this is a genuine strategy development environment or just a polished retail charting package with AI features bolted on. I tested the platform across all feature categories — here’s what actually works and where it falls short for systematic analysis.
What Is TrendSpider?
TrendSpider is a web-based trading platform founded in 2016 that has grown into an all-in-one technical analysis, strategy backtesting, and automated execution environment. Unlike TradingView (community charting) or Trade Ideas (AI scanning only), TrendSpider attempts to cover the full workflow: find a pattern, backtest it, train an ML model on it, and deploy it as a live bot.
Core differentiator for quants: The automated pattern recognition engine detects trendlines, Fibonacci levels, and candlestick patterns algorithmically — removing manual chart-drawing bias. The AI Strategy Lab lets you train ML models on any symbol/timeframe without writing code.
Key Features for Quant Research
1. Automated Pattern Recognition
The platform’s original strength. TrendSpider’s algorithms scan charts for:
- Trendlines — Auto-detects support/resistance lines across multiple timeframes, ranks them by the number of touches
- Chart patterns — Head & shoulders, flags, wedges, triangles, double tops/bottoms
- Candlestick patterns — 100+ recognized formations with statistical significance scoring
- Fibonacci retracements — Auto-plotted from algorithmically identified swing points
- Raindrop charts — Proprietary volume-weighted price distribution visualization
Quant perspective: The pattern recognition is genuinely useful for reducing chart review time. Instead of manually drawing trendlines across 50 symbols, you run a scanner that flags stocks forming specific patterns. The statistical significance scoring (how often this pattern led to a breakout historically) adds a data-driven layer that most charting tools lack.
The limitation is that it’s all technical — there’s no fundamental data integration into the pattern scoring. A breakout from a head-and-shoulders on a stock with deteriorating fundamentals gets the same score as one with improving financials.
2. AI Strategy Lab
This is the feature most relevant to quant workflows. The Strategy Lab lets you train ML models on historical data without writing Python.
| Capability | Details |
|---|---|
| Model type | Gradient-boosted trees (similar to XGBoost/LightGBM) |
| Training inputs | Price, volume, indicator values, pattern signals, timeframe data |
| Target variable | Price direction over configurable N-period lookahead |
| Training window | Configurable (default: 2 years of daily data) |
| Output | Prediction probability score (0-100) plotted on chart |
| Retraining | Scheduled or manual |
The models train on your selected features and produce a probability score plotted directly on the chart. For a quant, this is a pre-built ML pipeline for directional prediction — useful as a feature in a broader ensemble, not as a standalone signal.
Critical limitation: You cannot export the model weights or feature importance matrices. The model is a black box within TrendSpider. You can see the prediction output on the chart, but you cannot inspect SHAP values, feature contributions, or import the model into your own backtesting framework. This limits its use in production quant pipelines.
3. Strategy Tester (Backtesting Engine)
The backtesting engine supports point-and-click strategy construction without coding:
- Entry conditions: Indicator crossovers, pattern signals, price levels, ML score thresholds
- Exit conditions: Target profit, trailing stop, time stop, indicator-based
- Position sizing: Fixed, percentage, volatility-adjusted
- Multi-symbol backtesting: Run the same strategy across a universe
- Performance metrics: Sharpe ratio, max drawdown, win rate, profit factor, CAGR
The backtester is competent for retail strategy work but lacks features required for serious quant development:
| Feature | TrendSpider | What Quants Need |
|---|---|---|
| Walk-forward analysis | — | ✅ Essential |
| Monte Carlo simulation | — | ✅ Required |
| Portfolio-level backtesting | — | ✅ Multi-strategy correlation |
| Transaction cost modeling | Simple slippage | ✅ Market impact + commission |
| Benchmark comparison | — | ✅ SPY/beta-relative metrics |
| Custom data import | — | ✅ Alternative data |
| API-driven backtesting | — | ✅ Programmatic control |
4. Sidekick AI
An LLM-based trading assistant integrated across the platform. Sidekick can:
- Answer questions about your charts (“What’s the volume profile on NVDA?”)
- Analyze backtest results and highlight weaknesses
- Build scanners from natural language (“Find stocks with RSI < 30 and volume > 1.5x average”)
- Perform multi-symbol deep research across fundamentals and technicals
- Generate Pine Script–like strategy code
Quant perspective: Sidekick is useful for speeding up the exploration phase. Instead of manually configuring a scanner with 6 conditions, you type “Show me semiconductor stocks with bullish MACD crossover and increasing volume” and it builds the scan. The backtest analysis feature is genuinely helpful — it reviews your results and flags overfitting risks, small sample sizes, and poor risk/reward.
The limitation: Sidekick’s answers are only as good as the underlying data. It cannot access data outside TrendSpider’s ecosystem. You cannot ask it to incorporate alternative data from another source.
5. Market Scanning and Screening
TrendSpider includes both technical scanners (pattern-based, indicator-based) and a fundamental screener.
The technical scanner supports:
- All major indicators (RSI, MACD, SMA/EMA, Bollinger, Ichimoku, etc.)
- Pattern recognition flags
- Volume analysis
- Multi-timeframe confirmation
- Custom indicator combinations
The fundamental screener covers:
- Valuation multiples (P/E, P/S, P/B, EV/EBITDA)
- Growth rates (revenue, earnings, FCF)
- Profitability metrics (margins, ROE, ROIC)
- Financial health (debt/equity, current ratio)
Quant perspective: The screener is solid for the retail/active trader segment. The multi-timeframe scanning capability (scan for stocks bullish on weekly, daily, and 4-hour simultaneously) is genuinely useful. However, the fundamental data coverage is not as deep as dedicated tools like Fiscal.ai or Koyfin.
6. Alerts and Trading Bots
You can deploy alerts and automated trading bots that connect to your broker:
| Plan | Alerts | Bots |
|---|---|---|
| Standard | 30 simultaneous | 5 simultaneous |
| Premium | 60 | 15 |
| Enhanced | 100 | 30 |
| Advanced | 400 | 100 |
Bots execute based on strategy conditions you define in the Strategy Tester. Supported broker connections include Tradier, TD Ameritrade (if still active), Alpaca, and Interactive Brokers via SignalStack.
Quant perspective: The bot system is a no-code execution layer. For systematic traders, this replaces the need to build your own execution engine for simple strategies. The limitation is complexity — if your strategy requires multi-leg options, order routing logic, or portfolio-level risk management, you still need custom infrastructure.
Pricing
| Plan | Monthly | Annual (per month) | Key Limits |
|---|---|---|---|
| Standard | $89 | $54 ($648/yr) | 3 workspaces, 30 alerts, 5 bots |
| Premium | $149 | $91 ($1,092/yr) | 5 workspaces, 60 alerts, 15 bots |
| Enhanced | $197 | $122 ($1,464/yr) | 10 workspaces, 100 alerts, 30 bots |
| Advanced | $447 | $399 ($4,788/yr) | 15 workspaces, 400 alerts, 100 bots |
Trial: No free tier. 14-day paid trial: $19 (Standard), $29 (Premium), $39 (Enhanced), $49 (Advanced). Trial fee can be applied to first invoice if you upgrade.
Hidden costs:
- NASDAQ professional data fee (~$29/mo) if your account is registered as professional
- Backtesting capacity is throttled on Standard — heavy multi-year multi-symbol backtests run slowly
- Some advanced scanner presets require Premium or above
Verdict on pricing: Premium at $91/mo (annual) is the realistic entry point for active quants. Standard is too restrictive for systematic work (5 bots, 30 alerts). At $1,092/yr, Premium competes with TradingView Premium ($600/yr) plus a separate backtesting tool. The value proposition hinges on whether you use the automated pattern recognition and bot deployment.
Data Quality
TrendSpider sources market data from multiple providers (IQFeed, Polygon, and direct exchange feeds depending on tier and region). Key observations:
- US equities: Reliable, low-latency real-time data across all plans
- Futures: Real-time data included on Enhanced and above
- Forex and crypto: Available but limited depth compared to dedicated platforms
- Fundamental data: Good coverage for US large/mid-cap, thinner for small-cap and international
The data quality is adequate for technical analysis workflows. For tick-level or historical backtesting requiring precise OHLCV with corporate action adjustments, you’ll want to cross-reference against a dedicated data provider.
How It Fits in a Quant Workflow
TrendSpider sits in the strategy development and signal generation phase:
Data Ingestion → Feature Engineering → Signal Generation → Backtesting → Execution
                                        ↑
                            [TrendSpider here]
Best for:
- Rapid pattern-based signal generation across large universes
- No-code ML model training for directional prediction signals
- Visual backtesting with quick iteration on entry/exit logic
- Live deployment of simple rules-based strategies via bots
- Multi-timeframe scanning for factor confirmation
Not a replacement for:
- Production-grade backtesting (use QuantConnect, Backtrader, Nautilus)
- Sophisticated portfolio optimization
- Tick-level or order-book analysis
- Alternative data integration
- Feature engineering and model interpretability (no SHAP, no export)
Where it adds unique value: The automated pattern recognition + AI Strategy Lab combo is genuinely hard to replicate in-house without significant infrastructure. If your strategy work involves pattern-based signals enhanced by ML scoring, TrendSpider gives you a working pipeline in hours instead of weeks.
Alternatives
| Tool | Strengths | Weaknesses | Price | Best For |
|---|---|---|---|---|
| TrendSpider | Auto pattern recognition, AI Strategy Lab, all-in-one | Limited backtesting sophistication, no model export | $54-399/mo | Pattern + ML signal generation |
| TradingView | Best-in-class charting, Pine Script ecosystem | No ML, no automated pattern scanning, limited backtesting | Free-$50/mo | Technical analysis, community strategies |
| Trade Ideas | Real-time AI scanning, backtesting | No charting, no bot deployment, expensive | $84-228/mo | Intraday signal scanning |
| QuantConnect | Full-stack quant platform, Python/C#, massive data library | Steep learning curve, no visual charting | Free-$50/mo | Production-grade strategy dev |
| Multicharts | Professional backtesting, portfolio-level | Desktop-only, expensive | $100-200/mo | Serious systematic backtesting |
Verdict
TrendSpider is a legitimate signal generation platform, not a complete quant development environment.
The automated pattern recognition engine saves real time in the research phase. The AI Strategy Lab lets you train ML models without writing Python, which lowers the barrier to testing ML-enhanced strategies. Sidekick AI accelerates the exploration loop, particularly for building complex multi-condition scanners from natural language.
The Premium plan ($91/mo annual) is the minimum viable entry for systematic work — Standard throttles backtesting and bot capacity too aggressively. The Enhanced plan ($122/mo) is appropriate if you run heavy backtesting across large universes.
What holds it back for quants: No walk-forward analysis, no Monte Carlo simulation, no model export, no portfolio-level backtesting, and limited fundamental data depth. The ML models are uninterpretable black boxes within the platform.
Score breakdown:
| Category | Rating | Notes |
|---|---|---|
| Automated Pattern Recognition | 9/10 | Best-in-class, algorithmically unbiased, multi-timeframe |
| AI Strategy Lab (ML) | 6/10 | Useful but no feature importance, no model export, no custom architectures |
| Backtesting Engine | 5/10 | Competent for simple strategies; lacks walk-forward, Monte Carlo, portfolio |
| Sidekick AI | 7/10 | Speeds up scanning and backtest analysis; limited by platform data scope |
| Market Coverage | 7/10 | Strong on US equities, thinner on international and fundamentals |
| Pricing Value | 6/10 | Premium at $91/mo is fair for the feature set; Advanced is overpriced |
| Quant Workflow Fit | 6/10 | Covers signal generation well; gaps in development and execution |
Bottom line: If your quant workflow relies on pattern-based signals enhanced by ML scoring, TrendSpider Premium or Enhanced pays for itself in reduced research time. For systematic strategy development requiring rigorous backtesting, model interpretability, and production deployment, pair it with a proper quant framework like QuantConnect or your own Python stack.
← Back to all posts