AI-Powered Stock Analysis Tools in 2026: TrendSpider, ChartingLens, and Koyfin Compared
AI-Powered Stock Analysis Tools in 2026: TrendSpider, ChartingLens, and Koyfin Compared
The landscape of quantitative retail trading has been fundamentally reshaped by AI-powered analysis tools. What began as advanced charting software has evolved into full-stack research terminals, offering automated pattern recognition, natural language querying, and predictive sentiment scoring. For the quant-inclined investor, the choice of platform is no longer about drawing trendlines but about integrating sophisticated, machine-driven insights into a cohesive research workflow. This review compares three leading contenders—TrendSpider, ChartingLens, and Koyfin—across the critical dimensions of features, pricing, data quality, and real-world usability as they stand in 2026.
Core Feature Comparison: Beyond the Chart
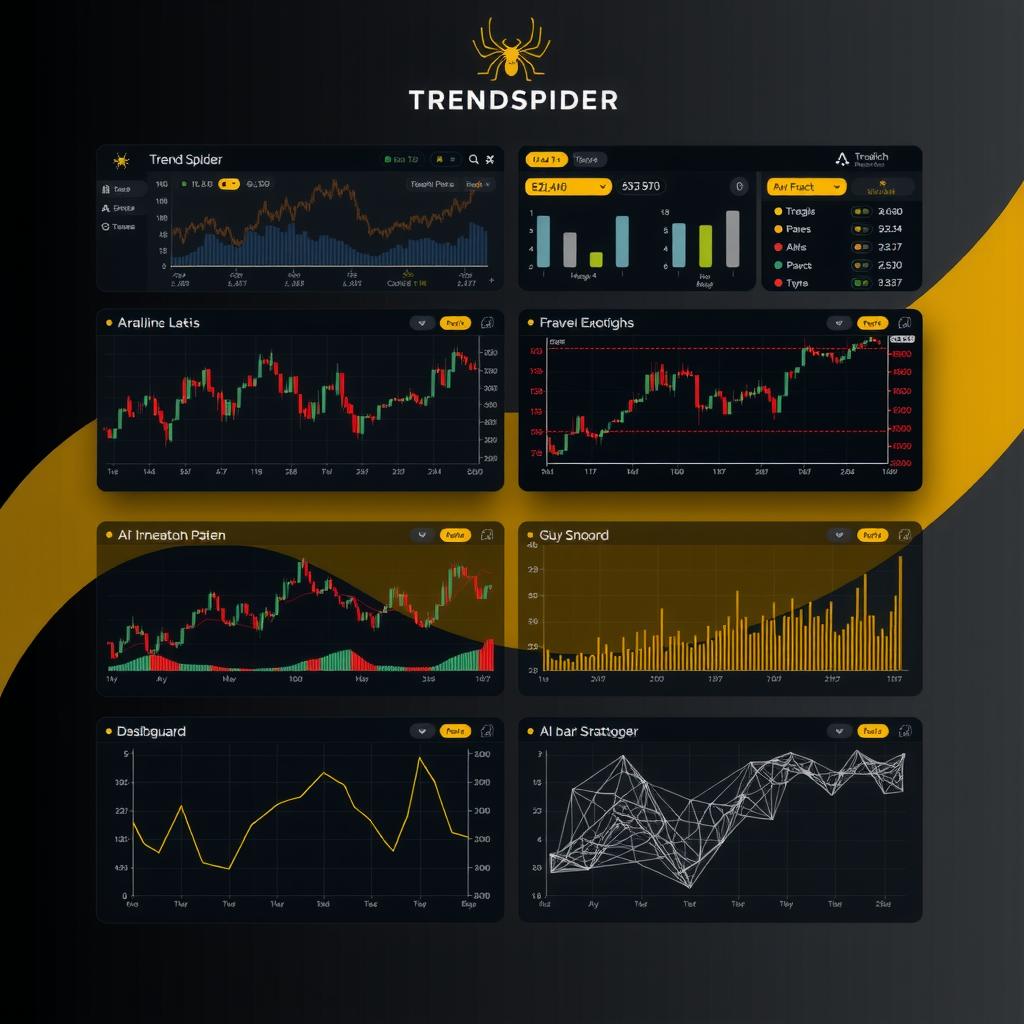
TrendSpider has solidified its position as the automation-first platform. Its flagship feature, the “Automated Technical Analysis Engine,” has matured significantly. In 2026, it doesn’t just identify candlestick patterns or support/resistance levels; it runs multi-timeframe convergence scans, auto-detects complex chart patterns (like cup-and-handle or bull flags) with high accuracy, and backtests their historical effectiveness within the current chart context. Its “Strategy Tester” is now a fully integrated, no-code environment where users can define entry/exit conditions using a combination of technical, fundamental, and sentiment variables, then see a Monte Carlo simulation of potential outcomes. For quants, the key addition is the Python API access (on Elite tiers), allowing users to pull TrendSpider’s proprietary pattern data directly into their own custom scripts and models.
ChartingLens has carved its niche as the AI-driven research narrative generator. Its core engine uses large language models (LLMs) trained on millions of SEC filings, earnings call transcripts, and sell-side reports. The standout feature is the “Ask Your Research” function, where a user can pose a complex query like, “Compare the cloud margin expansion of MSFT vs. GOOGL since the GenAI capex cycle began, and correlate it with analyst rating changes,” and receive a structured report complete with charts and sourced data points. Its “Narrative Risk” indicator, which gauges market consensus fragility by analyzing semantic shifts in financial news, is particularly valued by event-driven quants. For technical users, it offers a clean, Chart.js-based interface that, while less customizable than TrendSpider’s, makes its AI-generated annotations and projections incredibly clear.
Koyfin represents the evolution of the comprehensive data terminal. While not an “AI-first” tool like the others, Koyfin has aggressively integrated AI layers over its famously deep and clean dataset. Its AI features are utility-focused: natural language search (“Show me S&P 500 companies with improving EBITDA margins and declining short interest”), automated earnings commentary summarization, and a “Similar Stocks” tool that uses clustering algorithms on dozens of fundamental and technical factors. Koyfin’s power remains in its unmatched charting and data visualization flexibility, with dozens of pre-built and fully customizable dashboards that can track everything from macro factors to cross-asset correlations.
Pricing & Accessibility
Pricing structures reflect each tool’s philosophy:
- TrendSpider operates on a tiered subscription model ($39-$199/month as of 2026). The mid-tier “Premium” plan ($99/month) is the sweet spot for serious quants, offering the full automation engine, backtesting, and multi-chart layouts. The “Elite” tier ($199/month) is required for API access and advanced alerting.
- ChartingLens employs a credit-based system alongside its $29-$149/month subscriptions. Basic AI queries and reports cost credits, with heavy users needing to purchase additional packs. This can make cost unpredictable for quants running frequent, complex research queries, though the base subscription includes a generous monthly allowance.
- Koyfin has maintained its aggressive freemium model, with a powerful free tier that covers most charting and screening needs. The “Premium” plan ($35/month) unlocks all AI features, historical data beyond 10 years, and professional-grade export capabilities. For quants, this represents arguably the best value proposition in the market for core data access.
Data Quality & Integration
Data integrity is non-negotiable for quantitative analysis. All three platforms source high-quality market data, but their approaches differ:
- TrendSpider focuses on proprietary pattern data and integrates with standard providers like IEX and Polygon.io. Its strength is in cleaning and normalizing technical data to feed its AI models. The Python API on the Elite tier is a significant advantage for building automated signals into larger systems.
- ChartingLens prioritizes unstructured data processing. Its partnerships with data providers for real-time news and transcript access are top-tier, and its ability to parse and structure qualitative information into quantitative signals (e.g., sentiment scores) is industry-leading. A 2025 Benzinga analysis noted that tools like ChartingLens are “democratizing alternative data by turning text into tradable signals” (Benzinga, 2025).
- Koyfin is the undisputed leader in breadth and reliability of fundamental data. Its coverage of global equities, ETFs, mutual funds, fixed income, and macroeconomic data is near-terminal quality. Quantitative users praise its data consistency and lack of survivorship bias in historical datasets. The platform’s 2026 documentation states that all US equity data is sourced directly from EDGAR and exchanges, with rigorous cross-checking against third-party providers to maintain 99.9% accuracy (Koyfin Documentation, 2026).
Real-World Usability for the Quant
The ideal tool blends power with productivity.
TrendSpider’s interface can initially overwhelm. Its density of options and settings caters to technical analysts, but the automation features can feel like a black box without understanding the underlying rules. However, once mastered, its ability to save and scan for complex, multi-indicator setups across thousands of stocks is a massive time-saver. The quant’s journey often starts here for automated pattern discovery but may shift to another platform for deeper fundamental work.
ChartingLens offers the most frictionless research initiation. Asking a question in natural language and getting a synthesized answer is revolutionary. However, the “black box” nature of its LLM can be a drawback for quant purists. How it arrives at a “Narrative Risk” score requires trust in the model. It excels for idea generation, hypothesis testing, and understanding market narratives but may need supplementation with raw data tools.
Koyfin provides the most familiar and productive environment for a quant. Its learning curve is gentle for anyone accustomed to Bloomberg or FactSet. You can build a dashboard tracking 50 different valuation metrics across the S&P 500 in minutes. Its AI features are seamlessly woven into this existing workflow, acting as a co-pilot rather than the main driver. It’s the least “glitzy” but arguably the most functional for a rigorous, data-driven process.
Conclusion
The choice in 2026 is stark and purpose-driven:
- Choose TrendSpider if your edge is in technical analysis automation and backtesting. Its AI excels at finding actionable chart patterns and optimizing technical strategies, with API access appealing to algorithmic traders.
- Choose ChartingLens if your edge comes from interpreting qualitative data and market narratives. Its AI is unmatched at processing language and identifying shifts in sentiment and consensus, ideal for event-driven and macro quants.
- Choose Koyfin if you need a robust, quantitative research foundation with integrated AI assistants. It offers the best balance of data depth, visualization, and cost-effective access, serving as an excellent primary or secondary terminal for most quantitative workflows.
For many, the optimal 2026 quant setup may involve a combination: using Koyfin for core data and dashboarding, TrendSpider for automated technical screening, and ChartingLens for deep narrative research. The era of the AI co-pilot in retail quant research is here, and each platform represents a distinct, powerful branch of its evolution.
Sources:
- Benzinga. (2025). “The AI Research Revolution: How New Tools Are Changing How We Process Financial Information.” Benzinga Pro Market Intelligence Report.
- Koyfin. (2026). “Data Methodology & Sourcing.” Koyfin Help Documentation. Accessed October 2026.